
📜 Inventory Transaction Report
The Inventory Transaction Report shows every single inventory movement over a period — sales, purchases, transfers, conversions. Think of it as the full audit trail for your stock.
The On-Hand Report tells you “What do I have right now?”
The Transaction Report tells you “What happened to my stock — every in, every out, when, why, and how much?”
📦 What Does the Report Show?
| Column | What It Means |
|---|---|
| 📦 Group / Item | Item name (or category) |
| 🏷️ SKU # | Item barcode / SKU |
| 🧾 Vendor / Ticket | Source of transaction (vendor for IN, ticket # for OUT) |
| 📍 Location | Where stock changed (Store, Warehouse, etc.) |
| ⏰ Time | Exact date + time of transaction |
| 🔄 T.Type | Transaction type (IN / OUT / UNCHANGED / CONV) |
| 📝 Reason | Why it happened (TICKET SALES, NEW STOCK, ADJUST, etc.) |
| 🔢 Qty / Unit | How much moved (negative = out, positive = in) |
| 📊 On Hand | Running total after this transaction |
| 💵 Cost ($) | Per-unit cost |
| 💰 Total ($) | Quantity × Cost (the value of this transaction) |
🚀 How to Run the Report
Path: Back-Office → Inventory → Inventory Transaction Report
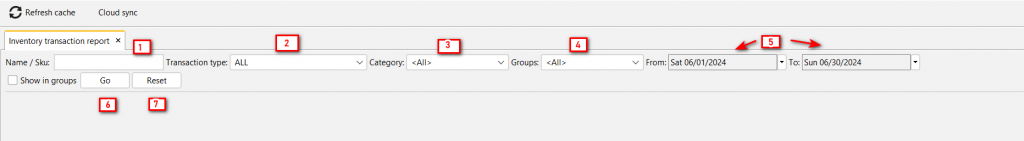
| Filter | Use For |
|---|---|
| Item Name / SKU | Track movement of one specific product |
| Transaction Type | IN / OUT / UNCHANGED / CONV / ALL |
| Category / Group | Filter to specific category (Beverages, Bakery) |
| Group-Wise | Show items grouped by category |
| Date Range | Defaults to today; pick a range for historical analysis |
| GO / Reset | Run the report or clear filters |
📄 Sample Report (Walked Through)
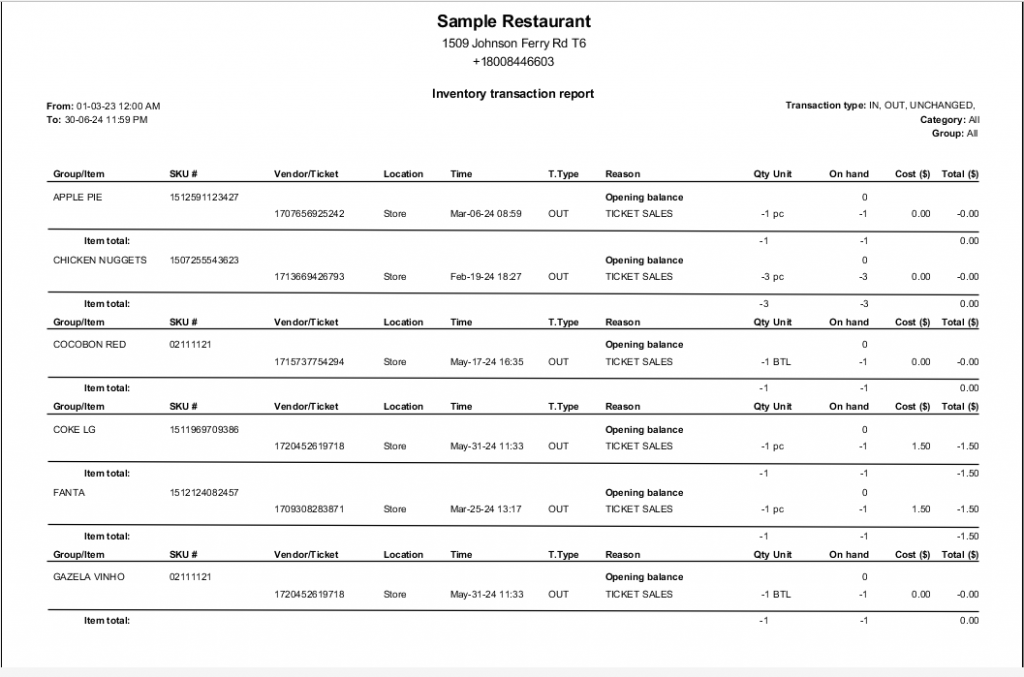
Sample Restaurant — Inventory Transaction Report (Mar 2023 → Jun 2024)
📊 The Same Report as a Clean Table
Sample Restaurant — 1509 Johnson Ferry Rd T6
📅 From: 01-03-23 12:00 AM | To: 30-06-24 11:59 PM | Type: IN, OUT, UNCHANGED | Category: All
| Item / SKU | Vendor/Ticket | Location | Time | Type | Reason | Qty | On Hand | Cost | Total |
|---|---|---|---|---|---|---|---|---|---|
| 🥧 APPLE PIE 1512591123427 |
— | — | Opening balance | — | — | — | 0 | — | — |
| 1707656925242 | Store | Mar-06-24 08:59 | OUT | TICKET SALES | -1 pc | -1 | $0.00 | -$0.00 | |
| Apple Pie Item Total → | -1 | -1 | — | $0.00 | |||||
| 🍗 CHICKEN NUGGETS 1507255543623 |
— | — | Opening balance | — | — | — | 0 | — | — |
| 1713669426793 | Store | Feb-19-24 18:27 | OUT | TICKET SALES | -3 pc | -3 | $0.00 | -$0.00 | |
| Chicken Nuggets Item Total → | -3 | -3 | — | $0.00 | |||||
| 🍷 COCOBON RED 02111121 |
— | — | Opening balance | — | — | — | 0 | — | — |
| 1715737754294 | Store | May-17-24 16:35 | OUT | TICKET SALES | -1 BTL | -1 | $0.00 | -$0.00 | |
| Cocobon Red Item Total → | -1 | -1 | — | $0.00 | |||||
| 🥤 COKE LG 1511969709386 |
— | — | Opening balance | — | — | — | 0 | — | — |
| 1720452619718 | Store | May-31-24 11:33 | OUT | TICKET SALES | -1 pc | -1 | $1.50 | -$1.50 | |
| Coke LG Item Total → | -1 | -1 | — | -$1.50 | |||||
| 🥤 FANTA 1512124082457 |
— | — | Opening balance | — | — | — | 0 | — | — |
| 1709308283871 | Store | Mar-25-24 13:17 | OUT | TICKET SALES | -1 pc | -1 | $1.50 | -$1.50 | |
| Fanta Item Total → | -1 | -1 | — | -$1.50 | |||||
| 🍷 GAZELA VINHO 02111121 |
— | — | Opening balance | — | — | — | 0 | — | — |
| 1720452619718 | Store | May-31-24 11:33 | OUT | TICKET SALES | -1 BTL | -1 | $0.00 | -$0.00 | |
| Gazela Vinho Item Total → | -1 | -1 | — | $0.00 | |||||
🔍 What Each Transaction Tells You
| Item Story | What Actually Happened |
|---|---|
| 🥧 Apple Pie: Opening 0 → Sold 1 → Now -1 | Customer ordered Apple Pie via ticket #1707656925242 on Mar-06-24 8:59 AM. No initial stock was recorded, so the on-hand went negative. |
| 🍗 Chicken Nuggets: -3 in one ticket | A single ticket included 3 nuggets. They all came out of stock together at 18:27. |
| 🍷 Cocobon Red Wine: -1 BTL | A bottle was sold (note the BTL unit, not pc). Cost shows $0 — wine cost wasn’t entered. |
| 🥤 Coke LG / Fanta: -1 pc, $1.50 cost each | Each soda sale costs the business $1.50 (cost of goods). Multiplied by sales = food cost calculation. |
| 🍷 Gazela Vinho: Same ticket as Coke (1720452619718) | Customer ordered both Coke and wine on the same ticket, both deducted at the same time. |
| 📊 All “Opening balance” rows show 0 | No items had stock entered at the start of the date range, only sales tracked. |
🔄 Transaction Types Explained
| Type | Direction | Common Reasons |
|---|---|---|
| IN | Stock added (+) | NEW STOCK, RETURN, ADJUST IN, GIFT |
| OUT | Stock removed (-) | TICKET SALES, WASTE, INTERNAL USE, ADJUST OUT |
| UNCHANGED | No quantity change | Cost adjustment without quantity change |
| CONV | Unit conversion | Stock conversion (e.g., 1 case → 24 cans) |
🚨 Red Flags to Watch For
| Symptom | What to Investigate |
|---|---|
| 📉 Negative on-hand running totals | Items being sold without proper Stock In or PO receipt |
| 💸 $0.00 cost on OUT transactions | Item cost wasn’t set up — fix in item record so food cost reports work |
| 🔁 Many OUT, no IN transactions | Manager forgot to record incoming deliveries |
| ⏰ Transactions outside business hours | Possible after-hours theft or unauthorized access |
| 🎫 Unusual ticket numbers | Voids, refunds, or test transactions polluting the data |
| 📍 Stock at wrong location | Direct stock-in instead of using Inventory Transfer |
🏪 Why It Matters by Business Type
🏪 Convenience Store / Grocery
Why critical: Trace every cigarette pack, every bottle of milk through the store. Spot patterns of theft (always at certain times?).
How to use: Run weekly + filter by high-shrink categories. Look for OUT without matching IN.
🍔 Restaurant
Why critical: Calculate accurate food cost. Compare ingredient OUT vs sales — are recipes using more than expected?
How to use: Run monthly. Filter by ingredient. Compare OUT total to sold dishes × recipe quantity.
🍷 Bar / Liquor Store
Why critical: Liquor laws often require auditable transaction records. Track every bottle through the system.
How to use: Archive monthly. Critical for tax audits + state compliance reports.
🛍️ Retail Store
Why critical: Spot fast-selling SKUs. Identify slow movers. Validate that scanning is working.
How to use: Filter by category. Sort by quantity. See top-movers vs bottom-shelf items.
📦 Multi-Location / Warehouse
Why critical: Track transfers between locations. Verify sister-store deliveries went through correctly.
How to use: Filter by location. Look for CONV (conversion) and transfer-related transactions.
🍕 Pizzeria / Catering
Why critical: Recipe accuracy matters. Did 100 pizzas sold deduct 100 dough balls? Or 110?
How to use: Run weekly. Compare ingredient OUT vs sold pizzas × recipe.
⭐ Best Practices
| Tip | Why |
|---|---|
| Run weekly for active stores | Catch issues before they grow into big losses |
| Filter by OUT only for shrinkage analysis | Spot suspicious removal patterns |
| Filter by IN only to verify deliveries | Catch missing PO receipts |
| Run per-item for problem investigations | When you see a discrepancy, drill into the item’s history |
| Cross-reference with On-Hand Report | Sum of transactions should equal current on-hand |
| Archive monthly snapshots | Required by accountants, useful for tax audits |
| Always fix $0 cost items | They distort your food-cost calculations |
📚 Related Guides
| → On-Hand Report | → Stock Count | → Re-Order & Shopping List |
📞 Need More Help?
Visit guide.orocube.com or contact helpdesk@orocube.net