

📊 Inventory On-Hand Report
The Inventory On-Hand Report is your at-a-glance summary of everything in stock — what items, where, how many, and what they’re worth. The single most important inventory report for daily operations.
It’s a printable snapshot of your warehouse: “What do I have, where is it, and how much is it worth right now?”
📦 What Does the Report Show?
| Column | What It Means |
|---|---|
| 📦 Group / Item | Item name (or grouped category) |
| 🏷️ SKU | Barcode or stock-keeping unit number |
| 📍 Location | Where the stock is kept (Store, Warehouse, Location A, etc.) |
| 🔢 Quantity | How much is on hand (can be negative — see “Red Flags”) |
| 📏 Unit | pc (piece), dz (dozen), kg, lb, etc. |
| 💵 Item Cost ($) | Cost per unit |
| 💰 Total Cost ($) | Quantity × Item Cost |
🚀 How to Run the Report
Path: Back-Office → Inventory → Inventory On-Hand Report
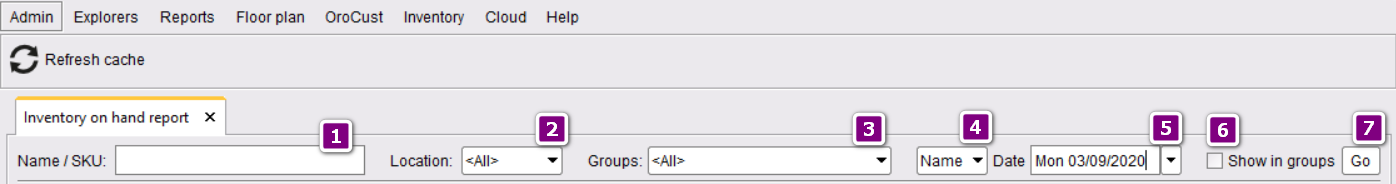
| Filter | Use For |
|---|---|
| Item Name / SKU | Look up specific products quickly |
| Location | Filter by Store, Warehouse, etc. |
| Group | Filter by category (Beverages, Bakery, etc.) |
| Search by | Choose Name or SKU as search method |
| Date | Snapshot at a specific date (defaults to today) |
| Show Group-Wise | Group items together for cleaner summaries |
Click GO to generate the report.
📄 Sample Report (Walked Through)
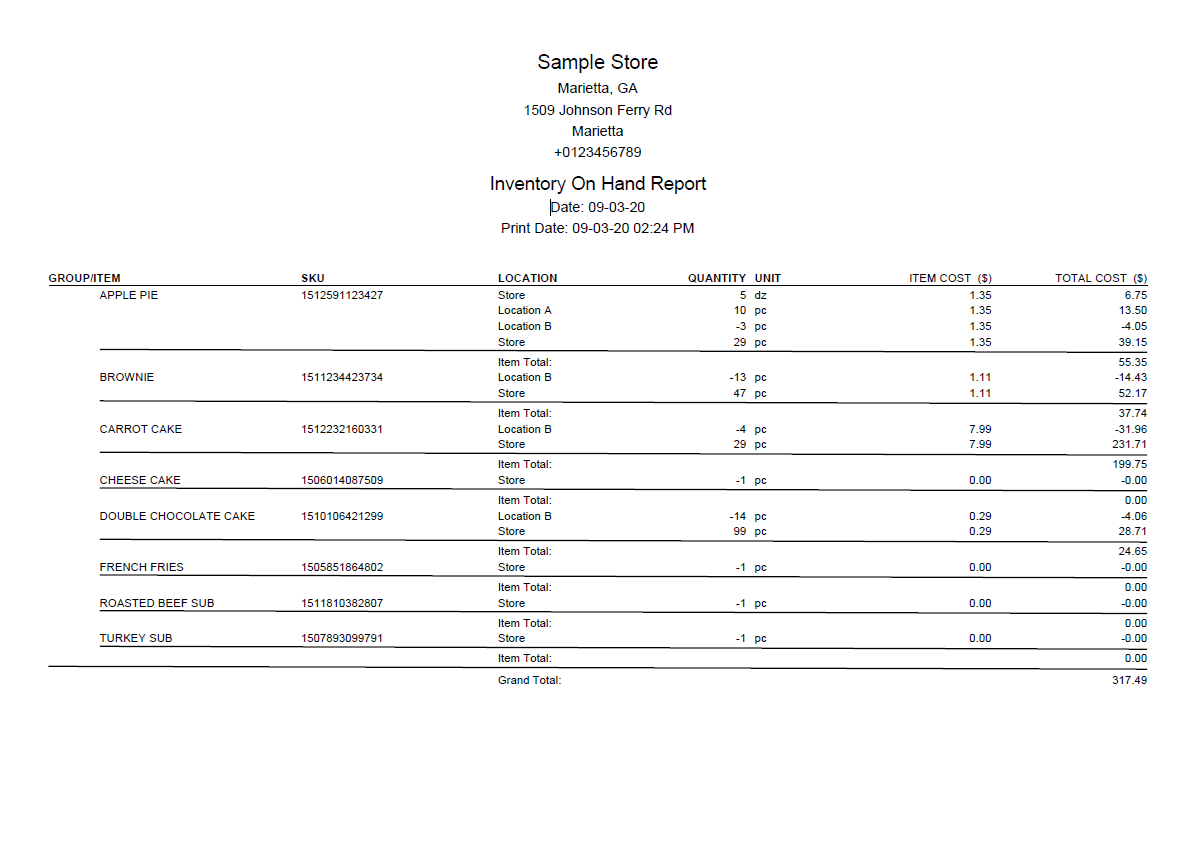
Sample Store — Inventory On-Hand Report (09-03-20)
📊 The Same Report as a Clean Table
Sample Store — Marietta, GA | 📅 09-03-20
| Item | SKU | Location | Qty | Unit | Cost | Total |
|---|---|---|---|---|---|---|
| 🥧 APPLE PIE | Store | 5 | dz | $1.35 | $6.75 | |
| SKU 1512591123427 | Location A | 10 | pc | $1.35 | $13.50 | |
| Location B | ⚠️ -3 | pc | $1.35 | -$4.05 | ||
| Store | 29 | pc | $1.35 | $39.15 | ||
| Apple Pie Total → | $55.35 | |||||
| 🍫 BROWNIE | Location B | ⚠️ -13 | pc | $1.11 | -$14.43 | |
| SKU 1511234423734 | Store | 47 | pc | $1.11 | $52.17 | |
| Brownie Total → | $37.74 | |||||
| 🥕 CARROT CAKE | Location B | ⚠️ -4 | pc | $7.99 | -$31.96 | |
| SKU 1512232160331 | Store | 29 | pc | $7.99 | $231.71 | |
| Carrot Cake Total → | $199.75 | |||||
| 🍰 CHEESE CAKE | Store | ⚠️ -1 | pc | $0.00 | $0.00 | |
| Cheese Cake Total → | $0.00 | |||||
| 🍫 DOUBLE CHOCOLATE CAKE | Location B | ⚠️ -14 | pc | $0.29 | -$4.06 | |
| SKU 1510106421299 | Store | 99 | pc | $0.29 | $28.71 | |
| Chocolate Cake Total → | $24.65 | |||||
| 🍟 FRENCH FRIES | Store | ⚠️ -1 | pc | $0.00 | $0.00 | |
| 🥪 ROASTED BEEF SUB | Store | ⚠️ -1 | pc | $0.00 | $0.00 | |
| 🦃 TURKEY SUB | Store | ⚠️ -1 | pc | $0.00 | $0.00 | |
| GRAND TOTAL → | $317.49 | |||||
🔍 What the Numbers Tell You
| Observation | What It Means |
|---|---|
| 🥧 Apple Pie at 4 places (5 dz Store + 10 pc Loc A + -3 pc Loc B + 29 pc Store) | Multi-location item — Store row appears twice because of different units (dozen vs piece) |
| ⚠️ Brownie -13 at Location B | Shows -$14.43 (negative inventory!) — means more was sold than received here |
| 💰 Carrot Cake = $199.75 (largest contribution) | 29 pieces × $7.99 = highest-value item in stock |
| 🆓 Cheese Cake at $0.00 cost | Cost was never recorded → fix this in the item record |
| 🍫 Double Chocolate: 99 in Store, -14 at Location B | Stock probably moved without using Inventory Transfer |
| 🍟 French Fries, Subs all show -1 | Sold 1 each, but no stock-in was recorded → opening balance issue |
| 📊 Grand Total $317.49 | Total inventory value (asset on books) |
🚨 Red Flags to Watch For
| Symptom | Likely Cause | Action |
|---|---|---|
| ⚠️ Negative quantity | Sold more than received; missing PO | Do a stock count + check for missing receiving |
| 💸 Cost = $0.00 | Cost wasn’t entered when stock was added | Edit item → enter the proper cost |
| 📍 Stock at unexpected location | Direct stock-in instead of transfer | Use Inventory Transfer to move stock cleanly |
| 📈 Same item appears twice in same location | Different unit types (dozen vs piece) | Use stock conversion to consolidate units |
| 🔍 Missing items (not on report) | Item not marked as inventory type | Edit item → set type to Inventory Item |
🏪 Why It Matters by Business Type
🏪 Convenience Store / Grocery
Why critical: Thousands of SKUs with thin margins. Need to know exactly what’s on hand to avoid stockouts and identify shrinkage.
How owners use it: Run weekly. Spot negative quantities. Compare to physical count.
🍔 Restaurant
Why critical: Track raw materials (beef, cheese, buns). Know food cost in real-time. Plan reorders before running out at lunch rush.
How owners use it: Run before vendor delivery day. Cross-reference with shopping list.
🍷 Bar / Liquor Store
Why critical: Liquor is high-shrinkage. Each bottle is tracked. Tax reporting often requires accurate on-hand counts.
How owners use it: Run weekly + reconcile against weekly stock count.
🛍️ Retail Store (Apparel/Shoes)
Why critical: Variants (size, color) multiply SKU count rapidly. Need to know which sizes sell, which sit. Drives reorder decisions.
How owners use it: Run weekly to identify slow movers and plan markdowns.
🍕 Pizzeria
Why critical: Dough, sauce, cheese, toppings tracked separately. Friday night rush requires knowing exactly what’s available.
How owners use it: Run mid-week to plan weekend shopping. Cross-reference with recipes for forecasting.
📦 Warehouse / Multi-Location
Why critical: Stock spread across multiple locations. The location-grouped view shows where stock lives.
How managers use it: Run by location to spot imbalances → trigger transfers.
⭐ Best Practices
| Tip | Why |
|---|---|
| Run the report before/after stock counts | See the system’s view, then verify against reality |
| Investigate every negative number | Negatives are always a sign of process failure |
| Print and archive monthly snapshots | Useful for accountants and tax season |
| Group by category for executive review | Cleaner summaries for high-level decisions |
| Filter by specific location for warehouse audits | Easier verification one section at a time |
| Always fix $0.00 cost items | They distort your inventory value & food-cost reports |
📚 Related Guides
| → Stock Count | → Transaction Report | → Re-Order & Shopping List |
📞 Need More Help?
Visit guide.orocube.com or contact helpdesk@orocube.net